Check example code at Github:
https://github.com/Sylvia-YiyinShen/MockMemoryLeak
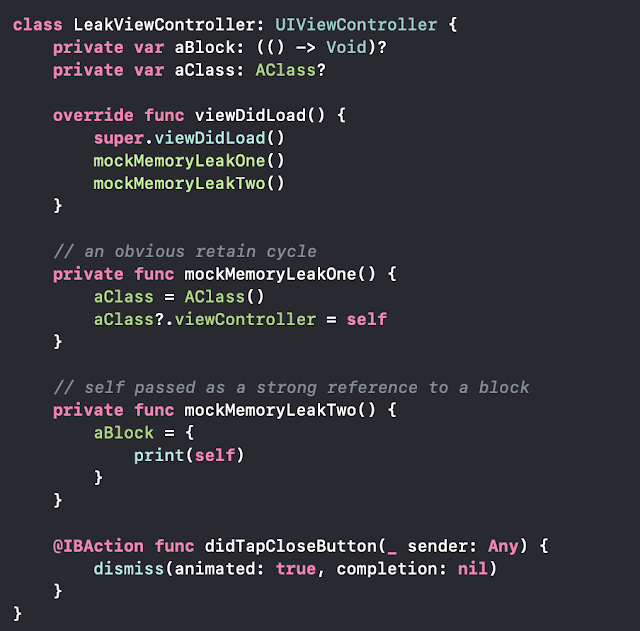
Here we mocked two memory leaks:
- An obvious retain cycle between LeakViewController - aClass
- 'self' passed as a strong reference to a block which also causes retain cycle between LeakViewController - aBlock
If you run the exapmle code project, open LeakViewController and close, for both of the mock cases, LeakViewController will never be released.

How to detect memory leak? Even you know nothing about the code?
Debug Memory Graph
Try mock memory leak then click the Debug Memory Graph button in the Debug area

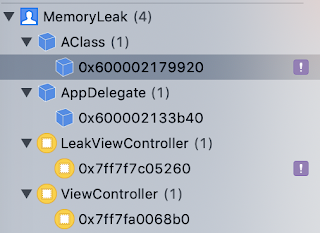
In the Debug Navigator panel(left panel), we will get MemoryLeak report like:

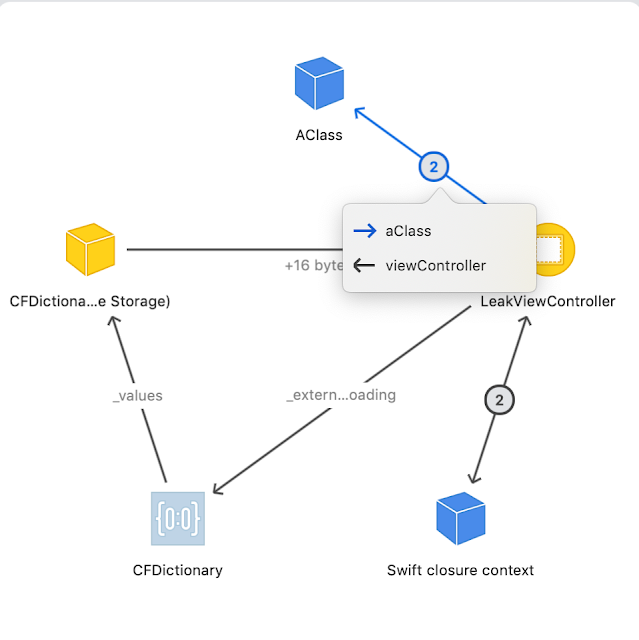
Click anything reported with purple icon, it gives a graph that indicates the where the retain cycle exists:

Leak Instrument
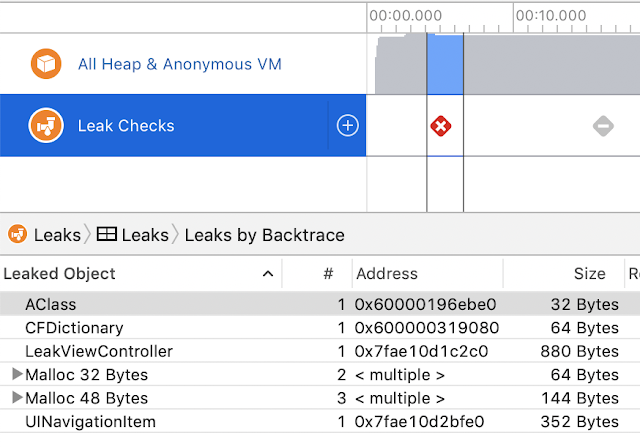
XCode -> Product -> Profile -> Choose Leak -> Tap the Red record button
Once it detected any leak, you will find report like this:

The LeakViewController and AClass instance will not be released. If repeatedly open and close the LeakViewController in this sample project, the number after the Object will also increase which means there are multiple LeakViewController created and have not been destroyed.
Fix memory leaks:
For the first mock case, we should make one reference weak. Since AClass will only exists when the LeakViewController exists, so we should make the viewController reference in AClass weak.
For the second mock case. we should declare self as weak or unowned when passing it through the block.
Fixed version is as below:

No comments:
Post a Comment